
Value investing : A Practical Test of Asness et al. (2015)
Composite Value Strategies in Action
In this post, I explore how combining multiple valuation metrics into a composite score can improve traditional value strategies. Using QuantConnect, I compare a simple P/E-based approach with a composite z-score model applied to the 1,000 most liquid U.S. stocks. The result?
+2.1% increase in CAGR
Sharpe Ratio improvement (0.32 vs 0.28)
Same universe, smarter ranking
I also share five actionable insights for building more effective value strategies—covering diversification, rebalancing, small-caps, and multi-factor models.
1. Diversification is the key
Systematic value strategies with broad diversification consistently outperform concentrated portfolios. Empirical evidence shows that a portfolio of undervalued assets across sectors and styles yields more stable, long-term returns.
2. Enhance Value with Complementary Factors
Augmenting value with factors like profitability and momentum improves risk-adjusted performance. Multi-factor models that integrate these dimensions tend to achieve higher Sharpe ratios and greater robustness.
3. Use Timely Data for Better Performance
Regularly updated metrics (e.g., through monthly rebalancing) align better with market dynamics and improve the responsiveness of value signals, enhancing overall strategy performance.
4. Multiple Measures of Value Are More Effective
Single metrics like book-to-market can be noisy or biased. Composite approaches—incorporating earnings yield, cash flow yield, and book value yield—offer a more resilient and predictive signal.
5. Focus on Small-Cap Stocks for Stronger Value Premium
Although it may seem counterintuitive, small-cap stocks exhibit a markedly stronger value premium than large-caps (see Exhibit 6 of the article), delivering higher potential returns.
Implementation Example
A basic P/E-based ranking applied to the 1,000 most liquid U.S. stocks priced above $5, selecting the top 50 and rebalancing monthly, yields modest results. When the universe is reduced to the top 20 by P/E ratio, the strategy still maintains a respectable CAGR of 8.5% with a Sharpe ratio of 0.28.
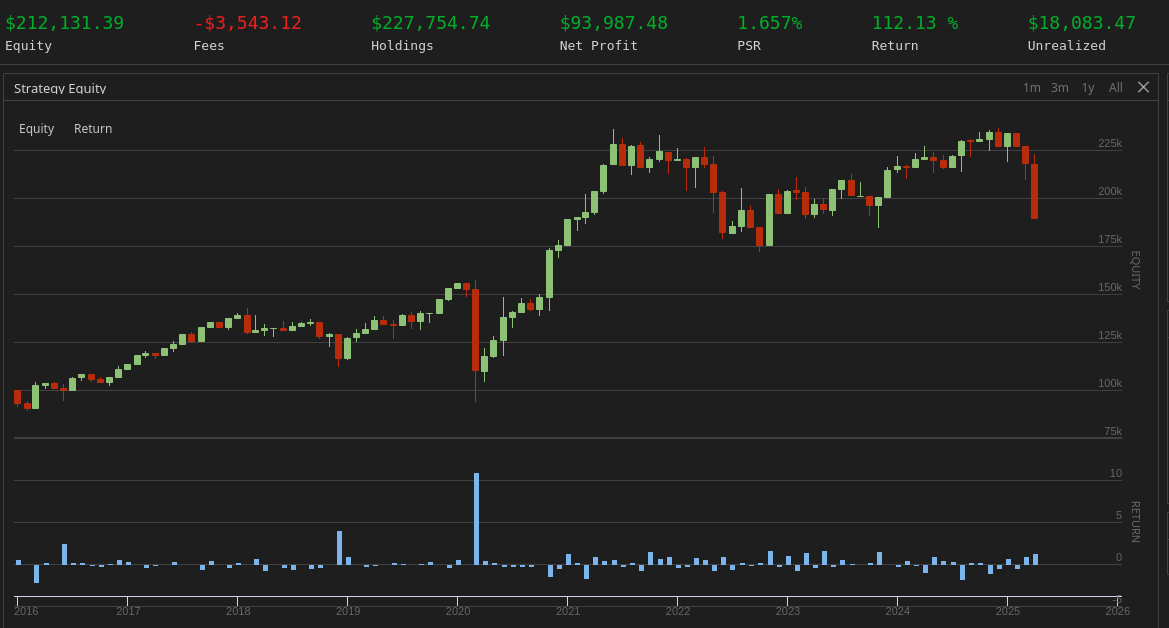
The ranking used in this first example is reproduced below :
def FineSelectionFunction(self, fine):
        # Sort by P/E ratio and take top 50 as value stocks
        sorted_by_pe = sorted(fine, key=lambda x: x.ValuationRatios.PERatio)
        self.value_stocks = [x.Symbol for x in sorted_by_pe[:20]]
        return self.value_stocks
However, replacing the ranking function with a composite z-score of multiple valuation metrics significantly enhances performance. The updated approach, using earnings yield, book value yield, cash flow yield, and free cash flow yield, produces a CAGR of 10.6% and a Sharpe ratio of 0.32 over the same period and universe.
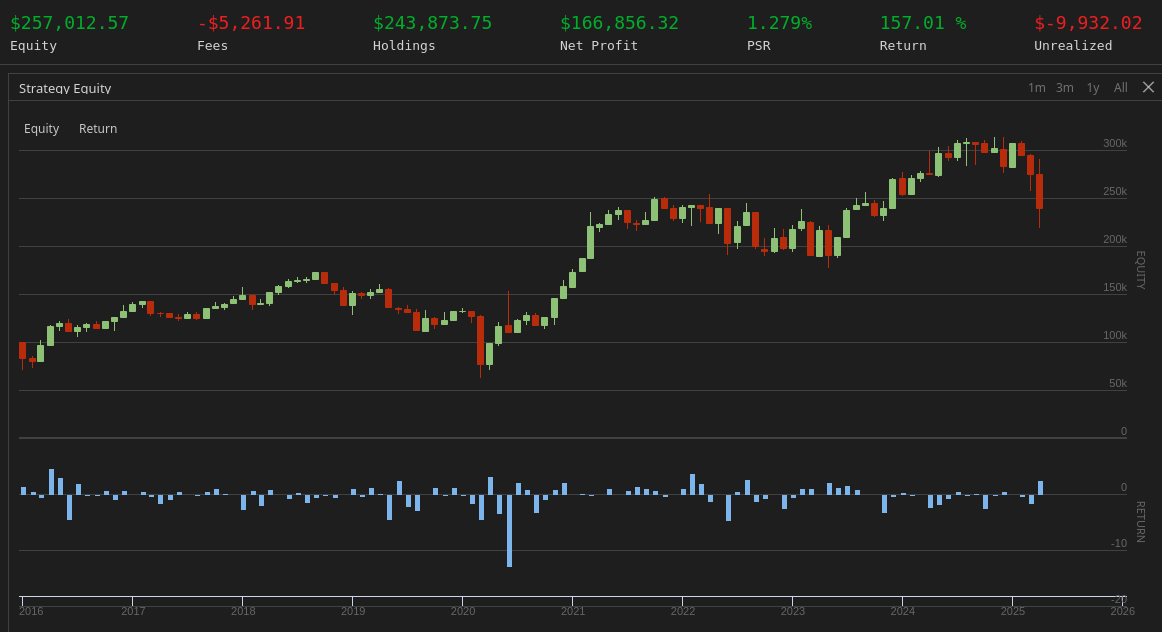
The ranking used in this second example is reproduced below :
def FineSelectionFunction(self, fine):
        """
        Composite z-score ranking with assignment to self.value_stocks:
        1. Define metrics
        2. Compute mean & std for each metric over valid values
        3. Calculate per-symbol z-scores and composite
        4. Assign top 20 symbols to self.value_stocks
        """
        # 1) Define metrics to use
        metrics = {
            'EarningYield':    lambda x: x.ValuationRatios.EarningYield,
            'BookValueYield':  lambda x: x.ValuationRatios.BookValueYield,
            'CFYield':         lambda x: x.ValuationRatios.CFYield,
            'FCFYield':        lambda x: x.ValuationRatios.FCFYield
        }

        # 2) Compute mean & std for each metric across valid entries
        stats = {}
        for name, func in metrics.items():
            vals = [func(x) for x in fine if func(x) is not None and func(x) > 0]
            if len(vals) >= 2:
                arr = np.array(vals, dtype=float)
                stats[name] = (arr.mean(), arr.std(ddof=0))
            else:
                stats[name] = (None, None)

        # 3) Build composite z-scores
        composites = []
        for x in fine:
            z_sum = 0.0
            count = 0
            for name, func in metrics.items():
                val = func(x)
                mu, sigma = stats[name]
                if mu is not None and sigma and val is not None and val > 0:
                    z_sum += (val - mu) / sigma
                    count += 1
            if count > 0:
                composites.append((x.Symbol, z_sum / count))

        # 4) Sort by composite z-score descending and take top 20
        composites.sort(key=lambda item: item[1], reverse=True)
        self.value_stocks = [symbol for symbol, _ in composites[:20]]
Key Takeaways
These results are derived from targeted backtests and not from a broader statistical sample.
Beyond ~20 holdings, the marginal diversification benefit diminishes.
Composite value metrics outperform single-ratio models and offer greater stability.
Optimal factor combinations evolve across time and regimes, reinforcing the need for adaptive, data-driven methodologies.
Conclusion
The empirical insights and practical examples discussed in this article are drawn from the framework established by Asness et al. (2015) in Fact, Fiction, and Value Investing. Their findings demonstrate that value strategies grounded in diversified, multi-factor models consistently deliver superior risk-adjusted returns. This analysis reaffirms that value investing remains a robust approach when executed with composite scoring, systematic diversification, and timely rebalancing.
References
Asness, Cliff S. and Frazzini, Andrea and Israel, Ronen and Moskowitz, Tobias J. and Moskowitz, Tobias J., Fact, Fiction, and Value Investing (June 1, 2015). Published in Journal of Portfolio Management, Fall 2015, Vol. 42, No. 1, Available at SSRN: https://ssrn.com/abstract=2595747 or http://dx.doi.org/10.2139/ssrn.2595747